Ling Ma
Email:[email protected]
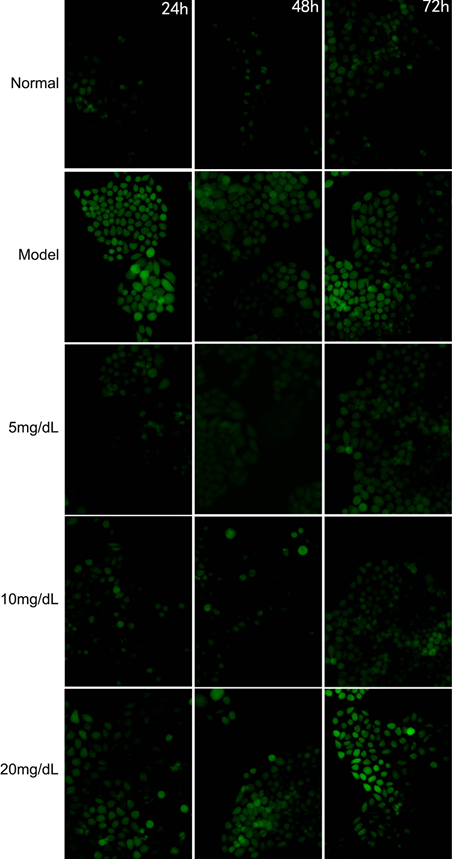
Corresponding AuthorLing Ma Email:[email protected] AffiliationWei Xiang 1, Shi Cheng 2, Yong Zhou3, Ling Ma4* 1 Department of Nutrition and Diet, Changzhou Traditional Chinese Medicine Hospital, Changzhou, China, 213000 2 Department of Nutrition and Food Hygiene, School of Public Health, Xinjiang Medical University, 830011. 3 Department of Medical Cell Biology and Genetics, College of Preclinical Medicine, Southwest Medical University, Luzhou, China, 646000. 4 Department of Nutrition and Food Hygiene, School of Public Health, Southwest Medicine University, Luzhou, China, 646000. CitationW.Xiang, S.Cheng, Y.Zhou, M.Ling, The impact of uric acid treatment on mitochlondria morphology and function in a steatosis model of L-02 cells (2020) Journal of Food Science & Technology 5(5) AbstractBackground and objectives: Nonalcoholic fatty liver disease (NAFLD) is one of the most prevalent chronic diseases worldwide. Oxidative stress (OS) is a major contributor toward NAFLD development, while mitochondria play a central role in OS. Our previous study has shown that uric acid (UA), as a dual function metabolite, could alleviate OS. This study examined the impact of UA on mitochondria morphology and function in a model of steatosis using L-02 cells to explore the pathogenesis of NAFLD. Methods: The L‑02 hepatocyte cell line was used to develop a steatosis cell model via 0.3 mM oleic acid (OA) over 24 h, subsequently treated with uric acid (UA) dose of 5, 10, and 20 mg/dL for 24, 48, and 72 h, respectively. The fluorescence intensity of reactive oxygen species (ROS), apoptosis rate, and activity of Succinate dehydrogenase(SDH), cytochrome oxidas(CCO), and adenosine triphosphate(ATP) synthase in electron transport chain (ETC), as well as the content of ATP and 8-OH-dG were examined; ultrastructure was observed under an electron microscope. Results: Treatment with UA at a concentration of 5 and 10 mg/dL decreased the rate of ROS production, apoptosis, and 8-OH-dG concentration, while supporting ATP recovery, and SDH activity in the steatosis model cell. It also promoted lipid droplet metabolism; however, the recovery of mitochondria morphology was not obvious. Conclusions: Treatment with UA dose of 5 and 10 mg/dL could protect mitochondria from OS damage. Future research requires a more stable and effective model. keywords : electron transport chain, oxidative stress, nonalcoholic fatty liver disease IntroductionNonalcoholic fatty liver disease (NAFLD) is among the most prevalent chronic diseases worldwide (1) that is particularly prominent in developed countries. The pathogenesis of NAFLD involves steatosis that progresses to hepatitis, cirrhosis, and, in some cases, carcinoma (3). A growing body of evidence suggests that early stages of NAFLD, defined by steatosis that progresses to hepatitis, involve mitochondrial dysfunction (4, 5). This mechanism is easy to observe, as mitochondria are the main site of lipid metabolism; when oxidative capacity of mitochondria increases due to intracellular accretion of lipids, which promotes oxidative stress (OS) that contributes to the development of NAFLD (6). Uric acid (UA), which is essential to human body function, can neutralize the activity of reactive oxygen species (ROS) to maintain balance between oxidative and antioxidative function (7). However, as living standards improve, the demand for the antioxidative properties of UA gradually decreases. UA is associated with obesity (8), type 2 diabetes (9), and chronic kidney disease (10); nevertheless, it remains an antioxidant within the human body (11). Our previous study (12) has demonstrated that UA at a dose of 5 mg/dL and 10 mg/dL could play an antioxidative role in an in vitro model of steatosis in L-02 cells. In this study, we examined the impact of UA on mitochondrial electron transport chain (ETC) parameters and its role in alleviating ETC inhibition to decrease the production of ROS, leading to reduction of OS in a steatosis model of L-02 cells. Materials & Methods2.1. Cell culture L-02 cells (KeyGen Biotech Co., Ltd., Nanjing, China) were cultured in a medium that contained 10% fetal bovine serum (Gibco; Thermo Fisher Scientific Inc., Waltham, MA, USA) and 1% penicillin-streptomycin solution (HyClone; GE Healthcare Life Sciences, Logan, UT, USA) in high-glucose Dulbecco’s minimum essential medium (HyClone; GE Healthcare Life Sciences, Logan, UT, USA). Cells were grown in 25-cm² culture bottles (Corning Inc., Corning, NY, USA) at 5% CO2 concertation and at temperature of 37 ℃. 2.2. Steatosis cell model development and UA treatment The method used to develop a steatosis cell model was similar to that used in our previous study, described in detail elsewhere (12). Briefly, we prepared a 10-mM working solution by mixing 28.25 mg of oleic acid (OA) and 4 mg of NaOH in 10 ml of ultrapure water; this working solution was added to a standard medium to prepare sodium oleate medium with OA concentration of 0.3 mM. The normal L-02 cell line was maintained in a sodium oleate medium for 24 h at 5% CO2 concentration and at temperature of 37 ℃. Once the steatosis model was developed, cells were inoculated into 6‑well plates at a density of 3x10⁵ cells/well. UA at the concentration of 5, 10, and 20 mg/dL was added to both steatosis model and untreated cells. The cells were incubated for 24, 48, and 72 h, respectively. 2.3. ROS detection We used chemofluorescence intensity to detect ROS production. Following the manufacturer’s instructions (Nanjing Jiancheng Bioengineering Institute, Nanjing, China), the UA treated cells were inoculated in 1-μM DCFH-DA solution (added to the standard medium) for 30 minutes at 5% CO2 concentration and at a temperature of 37 ℃. Once the medium was discarded, the incubated cells were photographed away from light at 200 times magnification, captured under fluorescence inversion microscope (Olympus, TKY, JP). 2.4. Apoptosis detection The rate of apoptosis in UA-treated cells was measured by flow cytometry with a suitable kit (Becton, Dickinson and Company, NY, USA). Briefly, cells growing in a 6-well plate were digested by trypsin. Washed with the PBS, cells were resuspended in 1 mL of binding buffer and taken out 100μL to a new EP tube. A total of 5 μL PE Annexin V and 5 μL 7-AAD solution were added to the new EP tube. Incubated for 15 minutes away from light, the cells were subsequently mixed with 400 μL of a binding buffer and detected by a flow cytometer (Beckman Coulter, Inc., CA, USA). 2.5. Mitochondrial function detection To explore the influence of increased ROS production and the effect of UA on mitochondrial function in steatosis cells, we detected ATP content and ETC activity, which included the levels of SDH, CCO, and ATP synthase. In addition, the levels of 8-OH-dG were measured as an indicator of mitochondrial function in order to assess any damage to mitochondrial DNA. Mitochondria were extracted from UA-treated cells, following the instructions of the relevant kit manufacturer (Solarbio Co. Ltd, Beijing, China). The extracted mitochondria were used to detect the rate of SDH activity (Solarbio Co. Ltd, Beijing, China), CCO (GENMED SCIENTIFICS, Inc. USA) and levels of ATP synthase (Nanjing Jiancheng Bioengineering Institute, Nanjing, China), each examined with the relevant kit. The total concent of ATP (Nanjing Jiancheng Bioengineering Institute, Nanjing, China) and 8-OH-dG (Bio-Swamp Biology limited, Hubei, China) was each detected with a suitable kit. 2.6. Ultrastructure observation The ultrastructure of UA-treated cells was observed with transmission electron microscopy. Briefly, digested by trypsin and washed by PBS, the cells treated with UA for 72 h were made to adhere to each other by adding 500 μL of FBS. Centrifuged with 80×g for 5 mins, the cells were fixed in glutaraldehyde stationary liquid. Subsequently, the fixed cells were sent to an electron microscope laboratory at the Xinjiang Medicine University for further treatment and to be photographed. 2.7. Statistical analysis All data were analyzed using statistical product and service solutions 23.0. All measurement data were tested to verify assumptions of normality of distribution and homogeneity of variance. Normally distributed data with homogeneous variance were subsequently examined with one‑way analysis of variance (ANOVA). Multiple comparisons were performed using the Tukey's method. Data that was normally distributed but had heterogeneous variance in one‑way ANOVA was subjected to correction analysis with the Brown‑Forsythe method. Multiple comparisons of data with heterogeneous variance were performed with the Games‑Howell method. Non-normally distributed data were examined with the Kruskal‑Wallis H test. Categorical data was analyzed using the chi-square test. Results3.1. ROS Content Fluorescent intensity of ROS in the model cells was stronger than that in the normal cells (Figure 1). ROS fluorescent intensity decreased in the model cells treated with 5,10 mg/dL after, 24, 48, 72 h; however, there were not any significant difference between 20 mg/dL and Model group.
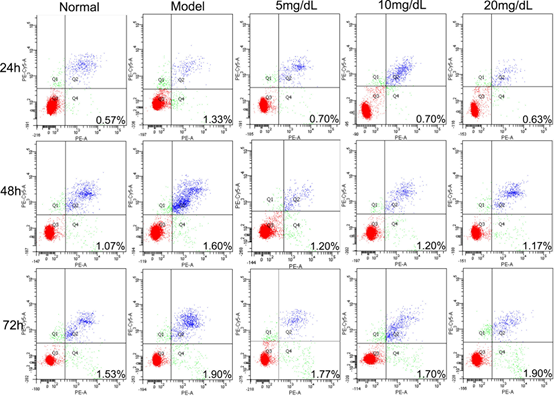
Fig 1. The Fluorescent intensity of ROS in the steatosis model L-02 cell treated with 5,10,20 mg/dL UA after 24, 48 and 72 h (200X) 3.2. Apoptosis rate No high-rate apoptosis was detected in any of the groups (Figure 2). The highest rate of apoptosis was equivalent to 1.9% and it was detected in the model cells treated with 20 mg/dL of UA over 72 h. The rate of apoptosis observed in the model cells was higher than that observed in normal cells over 72 h. Concurrently, it decreased significantly within 72 h after treating with UA in 5 mg/dL and 10 mg/dL group. The rate of 20 mg/dL group was lower than Model group within 24 h and 48 h, but it was not significant between 20 mg/dL at 72 h and Model group.
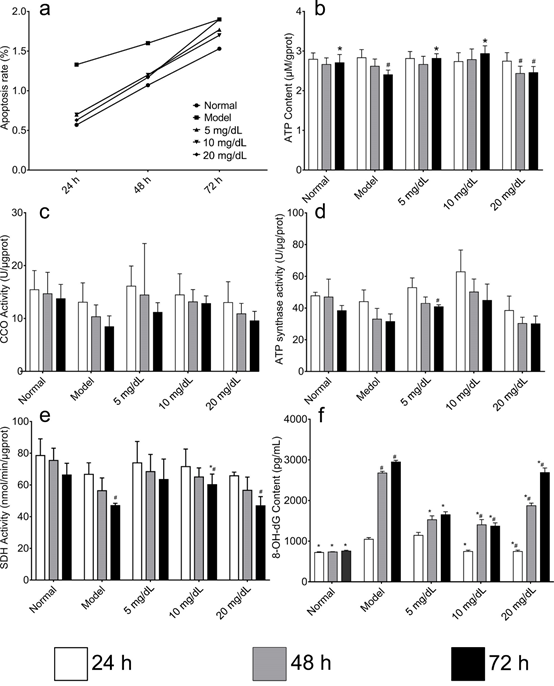
Fig 2. The rate of apoptosis in L-02 steatosis model cells treated with 5,10,20 mg/dL UA after 24, 48 and 72 h 3.3. Mitochondrial function ATP content in model cells was significantly lower than that in normal cells after 48 h; However, among cells treated with UA and Model group, the difference of ATP content were not significant (Figure 3). Although changes to ATP content could be expected to correspond to changes to activity of ETC components, no such changes were detected. A gradual decrease in the CCO activity rate was observed in every group; however, at each time point, these rates were higher than those observed in the model cells; however, these differences were not statistically significant. A similar pattern was detected in changes to the rate of ATP synthase activity, except for the 5 mg/dL group at 72 h. Finally, there were no statistically significant differences among the groups in the rate of SDH activity observed at 48 h. However, this rate was significantly lower in model than in normal cells at 72 h. Moreover, after treating the cells with 10 mg/dL UA, their activity significantly increased at 72 h; concurrently, it decreased in the 20 mg/dL group at 72 h. Unlike the ETC parameters, the levels of 8-OHdG in model cells were significantly higher than those in normal cells after 48 h. Moreover, at 72 h, UA-treated cells showed decreased levels of 8-OH-dG compared to model cells, in particular, the 5 mg/dL and 10 mg/dL group. In the 20 mg/dL group, the levels of 8-OH-dG increased gradually over time.
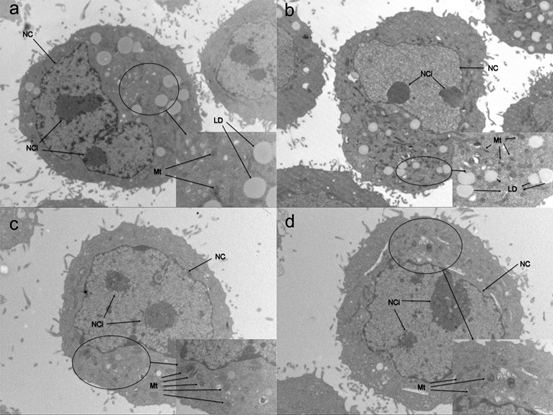
Fig 3. Comparison of apoptosis rate, ATP synthase activity, CCO activity, SDH activity and 8-OH-dG content in the mitochondria of steatosis model L-02 cell treated with 5,10,20 mg/ dL UA after 24, 48 and 72 h a. apoptosis rate b. ATP synthase activity c. CCO activity, d. SDH activity e. 8-OH-dG content *Compared with the control group, #compared with the 24 h group. 3.4. Ultrastructure Cells treated with different concentrations of UA were photographed after 72 h under an electron microscope (Figure 4) and the morphology of steatosis cells was examined. In the model cells, we found two nucleoli; the cell nucleus had an abnormal shape. Shrunk mitochondria were found in the cytoplasm. In the 5 mg/dL group, two nucleoli were found, but the nucleus morphology did not change compared with that of model cells. However, the number of mitochondria was higher in 5 mg/dL group; mitochondrial morphology revealed shrinking. There was no difference between the 5 mg/dL and 10 mg/dL group, except for the quantity of lipid droplets. In the 20 mg/dL group, the number of mitochondria was significantly higher than that in other groups, including the model cells; lipid droplets were not found. There were no other differences between the model and other cells.
Fig 4. Electron microscope photographs of steatosis model L-02 cells treated with with 5,10,20 mg/dL UA after 24, 48 and 72 h a. model cells b. 5 mg/dL group c. 10 mg/dL group d. 20 mg/dL group NC: nucleus NCi: nucleolus Mt: mitochondria LD: lipid droplet. DiscussionMitochondria are the main site of energy generation and play a central role in lipid metabolism. Previous studies have shown that mitochondrial dysfunction is an important factor in the pathogenesis of fatty liver disease (13). Excess oxidation of intracellular lipids increases the production of ROS, which disrupt the mitochondrial membrane potential, compromise antioxidant defense system function, and disrupt lipid metabolism. These mechanisms are associated with the development of NAFLD. In our study, after incubation with 0.3 mM OA over 24 h, the ROS production increased dramatically within 72 h compared to that of normal cells. Concurrently, treatment with 5 mg/dL and 10 mg/dL of UA decreased ROS production in the steatosis model cells. However, use of 20 mg/dL UA had no effect on this outcome. This finding is similar to that of our previous study (12) as well as other studies that have shown that normal serum UA concentration (5 mg/dL in our study) could assist the body antioxidative system in preventing oxidative damage (11, 14). Cells treated with UA demonstrated a decreased rate of apoptosis compared with model cells, in particular, cells treated with 5 mg/dL and 10 mg/dL of UA. This finding is likely due to decreased ROS concentration combined with oxidative capacity of UA. Moreover, increased production of ROS corresponded to an increase in 8-OH-dG concentration in the model cells, indicating early mitochondrial damage, which decreased following treatment with UA. These findings suggest that UA might protect mitochondria from damage, which might account for the antioxidative effect of UA that is associated with elimination of ROS, demonstrated in our previous study. In general, excess ROS production could result from lipid oxidation, which is the main pathway of lipid metabolism. As a major producer of ROS, mitochondria could generate more ROS when their membrane potential is inhibited, which is the key mechanism of oxidative stress in steatosis cells. However, in this study, we did not detect mitochondrial inhibition. As the ROS production increased in model cells, the ETC elements were not affected; in particular, there was no difference among groups in the rate of activity of CCO or the concentration of ATP synthase. Given these findings, indicative of normal mitochondrial function, the source of increased ROS production remains unclear; future studies should examine this phenomenon. The rate of apoptosis increased in the model cells; however, this increase was too small to account for the influence of steatosis on the cells. In our previous study, L-02 cells treated with 0.3 mM OA for 24 h could not induce OS, suggesting it is not enough to cause mitochondrial dysfunction. In a study by Einera (15), male mice C57BL/6NCrl fed Western diet for 24 weeks showed a greater rate of liver lipid accumulation than mice fed a standard diet. Except for decreased ATP levels in liver tissue, the author did not observe any signs of mitochondrial dysfunction. In 1988 (16), a ‘two-hit’ hypothesis of the mechanism of NAFLD development was proposed by Day; it included steatosis of hepatocyte as the first hit and OS, induced by steatosis, as the second hit. Our model represents the first of these two hits. Although the approach to model building used in this study is commonly employed, it does not yield a stable model, whether cell- or animal-based, and is thus limited in its capacity to simulate the development of NAFLD. Alternative methods include those used by Stellavato et al. (17) that entail building a steatosis model, using a 6 mM FFA mixture (linoleic acid: oleic acid=1:1), which represents a very high concentration (19 times higher than that used in the present study). In our previous study, at OA concentration of 0.4 mM, cell viability significantly decreased; at the concentration of 0.6 mM, used in pilot experiments, all cells died. Studies by Xiao-naHu (18), Wang (19) and Chen (20) used an FFA mixture (palmitic acid and OA) to create a steatosis model with the L-02 cell line. However, the effects were inconsistent, in particular, when assessing cell viability and apoptosis rate. These findings suggest a need for a more reliable method of building a steatosis model either in vitro or in vivo. Despite these limitations inherent to model building, we showed that the rate of SDH activity and the level of ATP were affected by steatosis; this effect was small but statistically significant and reversed by treatment with UA, in particular, at 5 mg/dL and 10 mg/dL concentration. SDH is the only ECT enzyme to directly participate in the Krebs cycle; it participates in electron but not in proton transfer of ECT. This finding indicates that SDH could play an important role in connecting two pathways of cellular metabolism; it could also be a sensitive indicator of mitochondrial function and energy metabolism. Our present findings confirmed our hypothesis that ATP content decreased as the activity rate of SDH decreased; in contrast, ATP content increased as the activity rate of SDH increased. However, we were not able to confirm whether the change to ATP content resulted from the change to the rate of SDH activity or from other factors associated with ROS production, including a high rate of UCP expression (21). Examination of the ultrastructure revealed that the quantity of lipid droplets in the 5 mg/dL group decreased compared to that in the model group; moreover, lipid droplets disappeared altogether in the 10 and 20 mg/dL group. This finding suggests that UA could accelerate the metabolism of lipid droplets in L-02 cells. To the best of our knowledge, no previous study has examined the mechanism through which UA could promote this phenomenon and studies are required to elucidate it. Moreover, the effect of UA treatment on mitochondrial morphology was clearly observed; the shrunk mitochondria did not recover their original size. OS is one of the main characteristics of NAFLD, in particular, at the early stage; mitochondria play a central role in OS. As a final product of purine metabolism, high level UA could induce OS; however, at 5 mg/dL and 10 mg/dL concentration, UA could protect cells from OS damage, as observed in this study. This study also demonstrated that UA could alleviate mitochondrial damage by eliminating ROS. Nevertheless, a more stable model is required for further research. AcknowledgementThis study was supported Southwest Medical University. References
0 Comments
Leave a Reply. |